Program Comics
Part 1
March 2024[Part 1] Part 2
Program Comics is a website for explaining algorithms visually, often using comics. It's a demo, rather than a live product, since I'm not focused on creating more content for it. Source code here.
1. Comics as a Medium for Learning
In Understanding Comics, Scott McCloud writes that a comic can take on any style and cover any content. A comic doesn't have to be drawn as cartoons or caricatures, nor be about fantasy or superheroes. To paraphrase McCloud, a comic is a deliberate sequence of spatially-adjacent pictures. So, the Egyptian painting that depicts the tomb of Menna is a comic and so is this:
Technically these two panels are part of a larger comic that aims to teach Dijkstra's algorithm.The example in this comic is taken from Josh Hug's slideshow on Dijkstra's.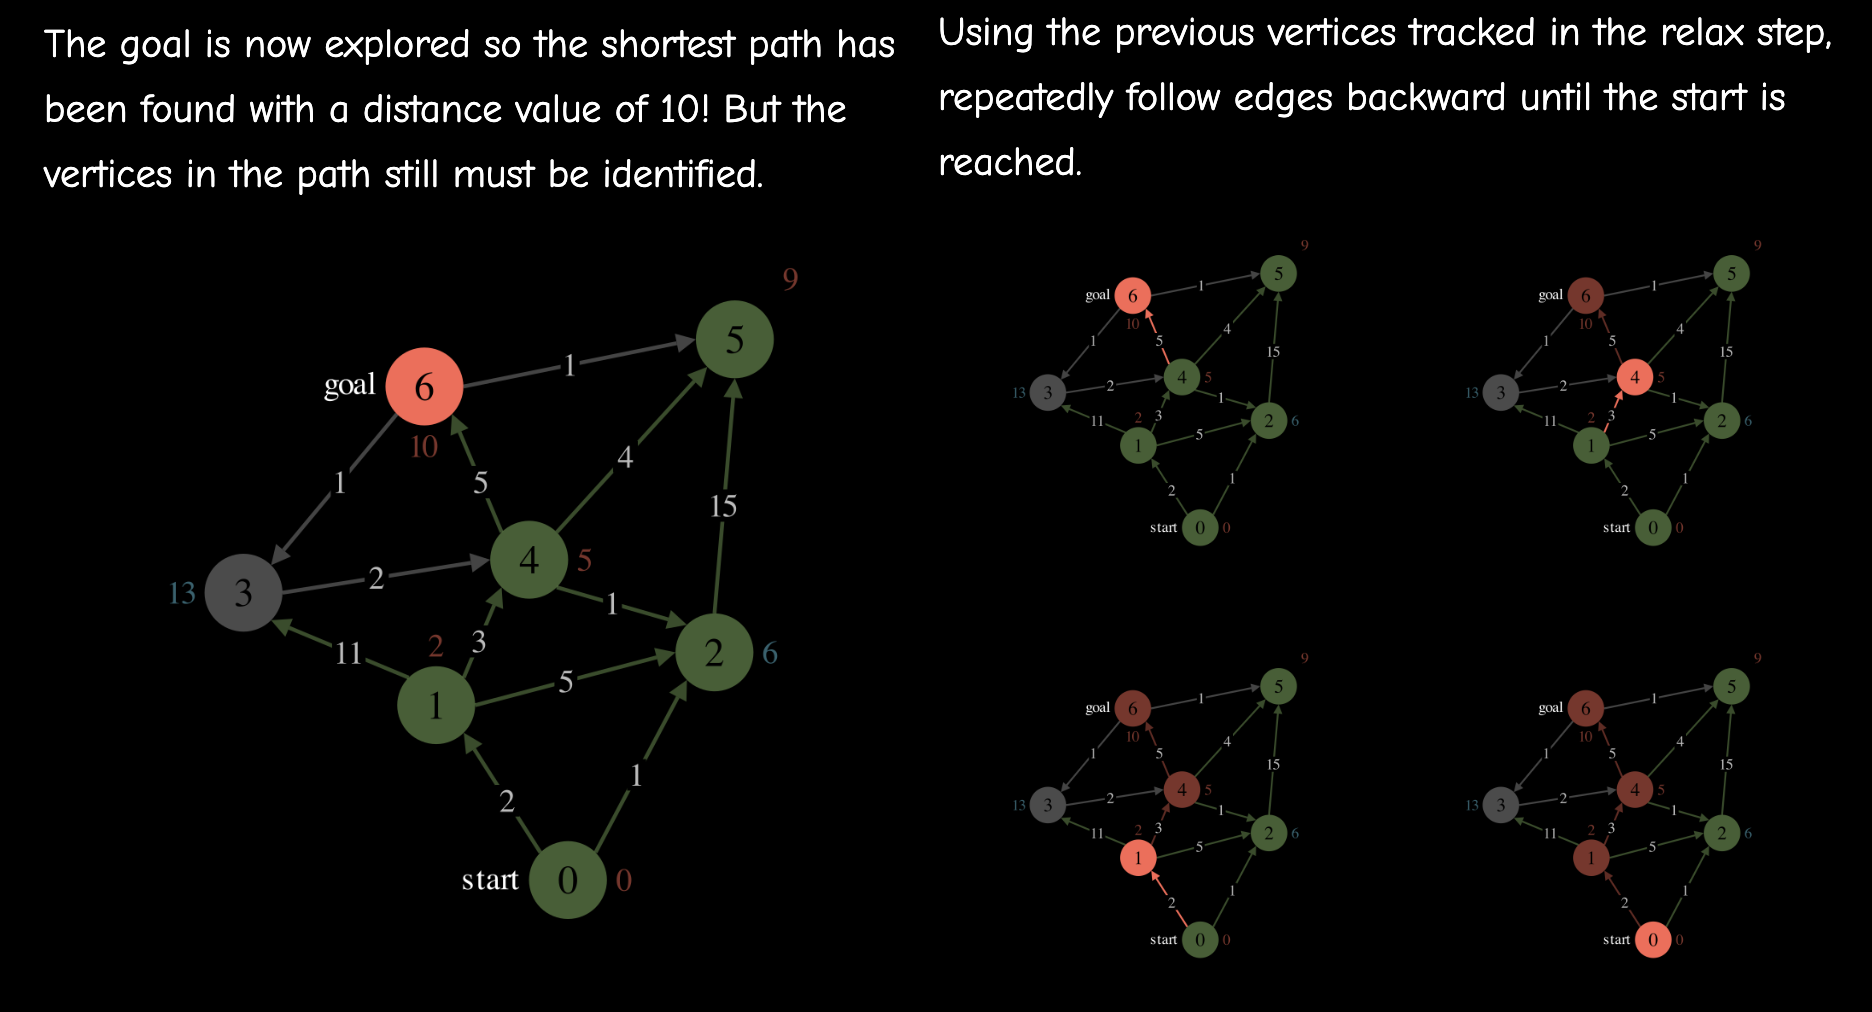
Because many technical concepts are visual, comics are a promising medium to explain them. A comic can show and tell, in contrast to traditional explanations like research papers and Wikipedia explanations, which primarily tell. 3blue1brown's youtube videos are a good example of showing and telling. But the youtube video, as a medium for learning, will always have some limitations. Unlike written content, videos do not make it easy to skim, review, retrieve, and connect content — all of which are important for in-depth learning. I think the comic can naturally take on the informal and visual qualities of video explanations that appeal to so many people while retaining the listed strengths of written content.
It's not surprising that "showing" is used minimally in today's written explanations. Drawing diagrams by hand often looks janky and using digital diagramming tools takes a lot of effort. But I think creating diagrams will be easier soon, either with an AI that can create diagrams directly (blackbox) or with an editor that humans use to create diagrams step by step that uses the AI as an implementation detail (human-in-the-loop).
2. Slideshows
This is an image. See the full slideshow here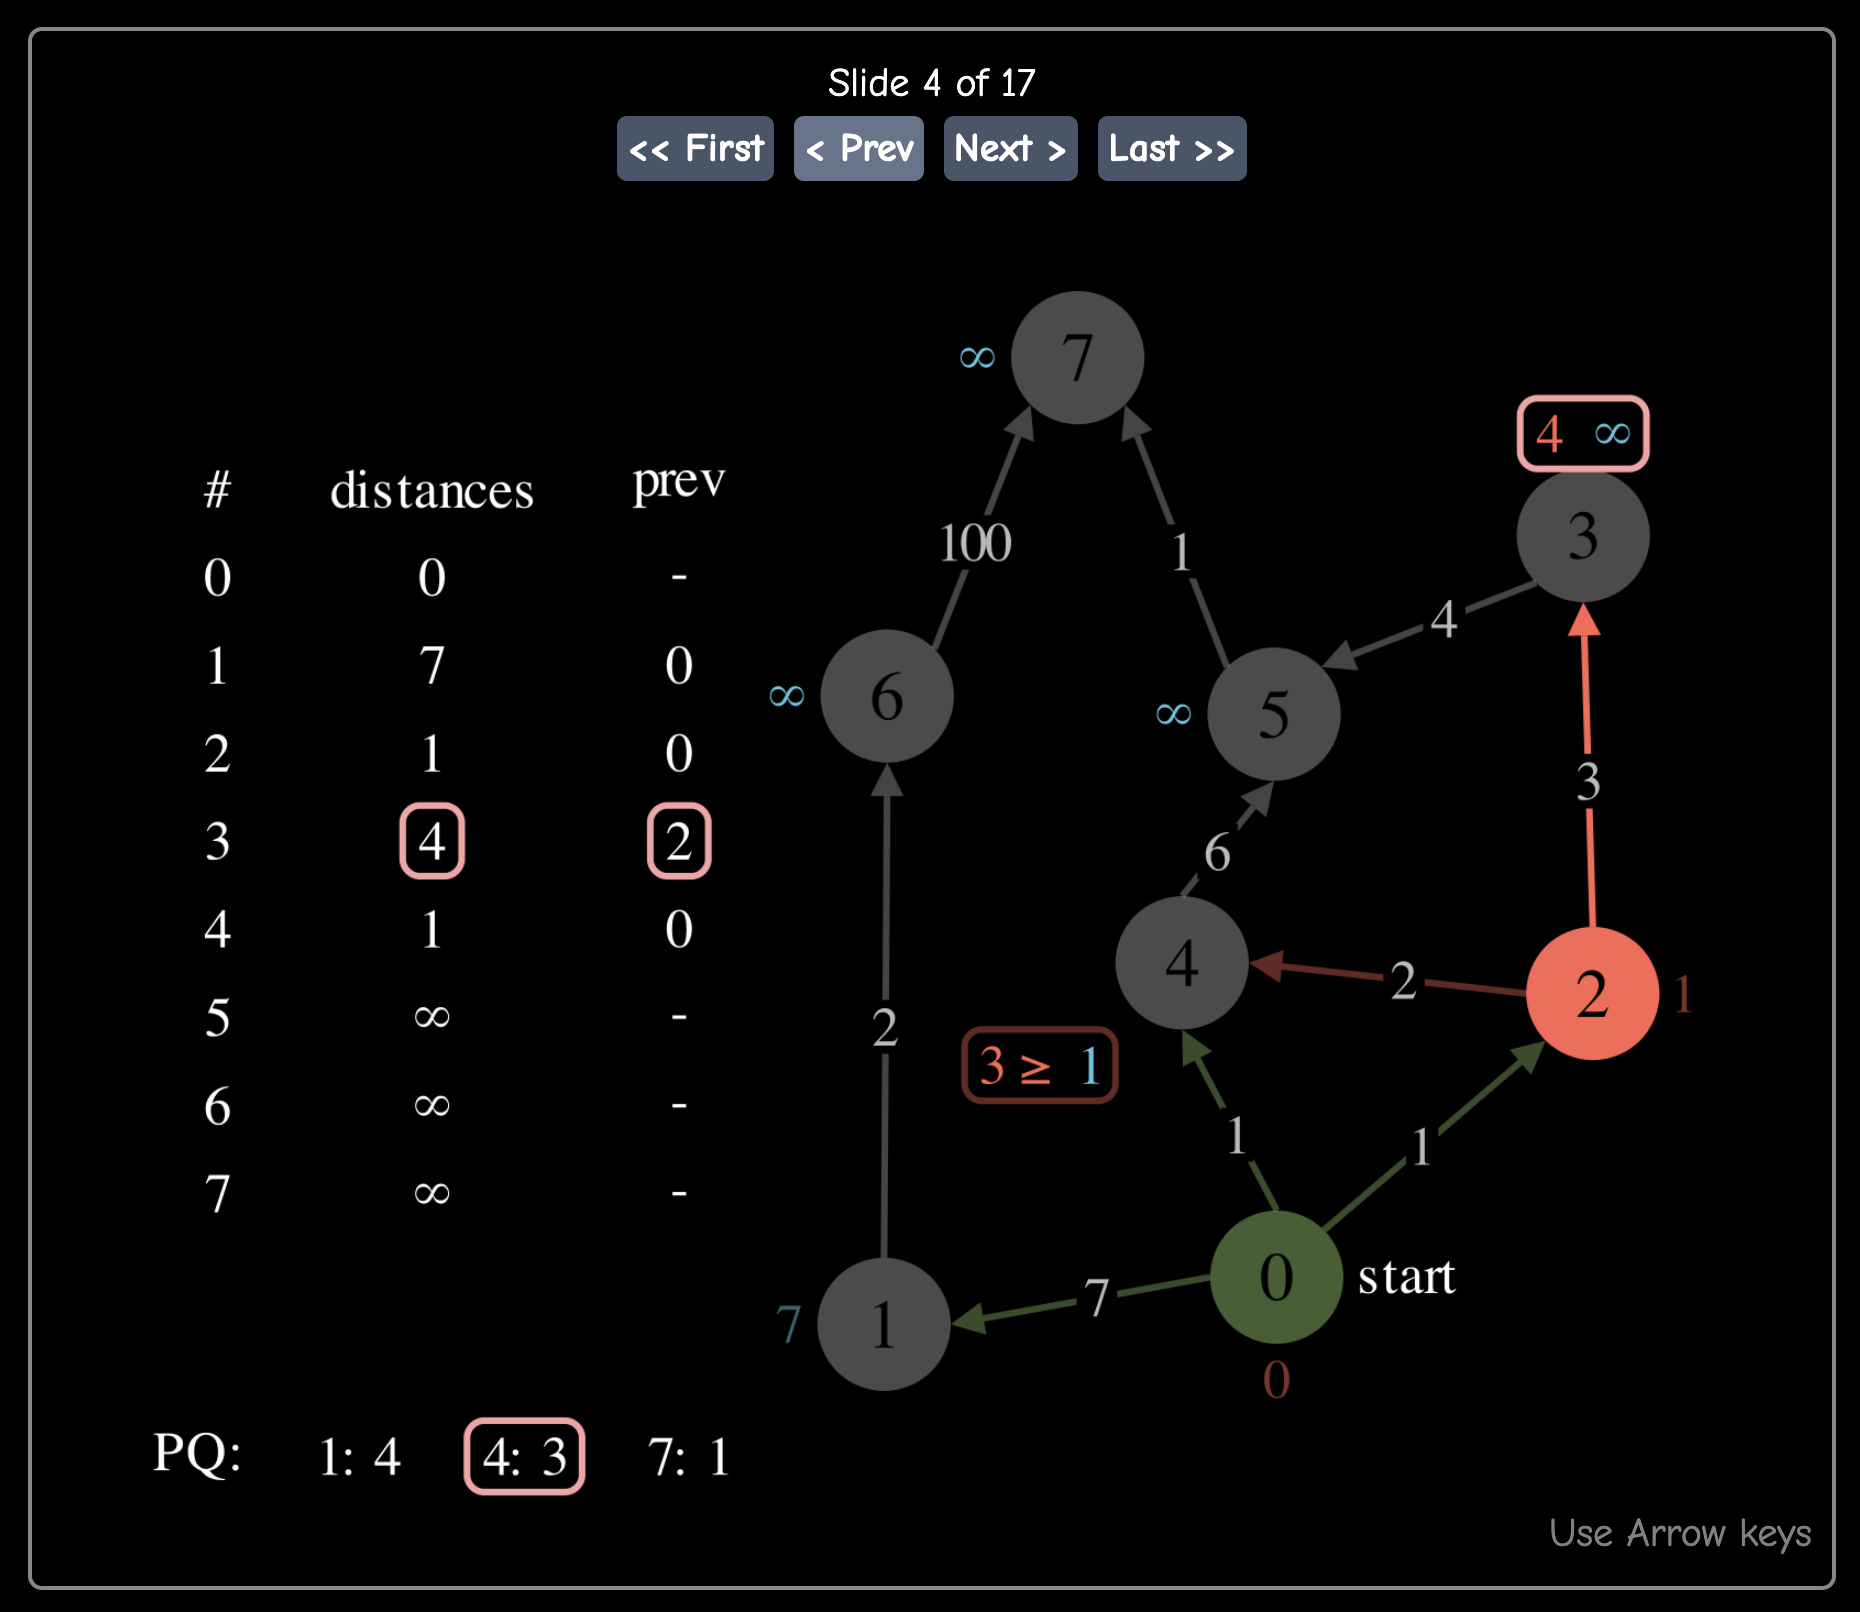
The goal of Program Comics is to explain algorithms visually. While slideshows are missing the spatially-adjacent property of comics, they're an important part of the visual vocabulary of Program Comics. They are particularly useful for understanding the progression of a program in steps by displaying the state changes on each slide, similar to a debugger but using visualization. The main interface of python tutor and its newborn cousin pandas tutor both do this.
In this explorable teaching A*, basic slideshows are upgraded to "animated slideshows", presenting the choice to see the steps one at a time (the micro) or to see the effect of the steps all at once (the macro). For now, comics and slideshows are the main elements in the visual vocabulary of Program Comics.
After looking at a comic created with code, adding interaction seems like a natural next step. But I don't think interaction beyond a basic slider adds unique learning value for people at the high school/college level. Often, the heavy interaction distracts from the content itself and can be replaced by a few labeled pictures.
3: Diagramming Tools
To build these diagrams, I used Manim Community Edition, the community-maintained library based on 3blue1brown's original math animation library, manim.
Although Manim is typically used for animation, I preferred it over other programmatic diagramming tools such as Penrose, TikZ, and plain HTML/CSS.
Manim has several advantages: it's a library in a general-purpose programming language rather than a domain-specific language; it uses python's object-oriented programming which is natural for this domain and familiar to many developers; and it's highly declarative with commands such as obj1.next_to(obj2).
A core feature of Manim is its "relational commands" like next_to, move_to, align_to which can operate on any manim object by using its bounding box under the hood.
Not many other tools offer similar functionality, although I did find one, Bluefish, still in the research stage.
Instead of using a programmatic diagramming tool, I could have used a direct manipulation tool such as Figma or Powerpoint — or even pencil and paper. However, programming grants flexibility in style and content in ways direct manipulation cannot. I think the crux is that code permits reusable bricks that can be varied with parameters and composed together whereas direct manipulation only allows reuse through copy-paste. Less centrally, an advantage of a programmatic diagram is that it can be regenerated instantly for a new data input. And a disadvantage is that only people who know programming can use the tool. Expect more on this theme in future Acts.
4. Next Steps
This work is in Demo Status. Good learning content is hard to create; it's not a one-off article but a module that transmits a way of thinking. The content I produced so far is... unfinished. In fact, arguably my focus on the algorithm behavior conflicts with the spirit of programming in which Dijkstra derived this algorithm. He advocates solving a programming problem by deriving a formula. And while I don't entirely agree, I think my explanations should do more of that.
But creating these diagrams is very time-intensive so I'm going to try to change that first. This is my serious context that grounds the tools that follow. (Update: This project failed the serious context test actually. It did inform the design of projects to follow.) See you in Part 2.
Credit: I first found the idea of applying the medium of comics to technical writing in Bret Victor's Scientific Communication As Sequential Art.