Still Manim Editor
Part 2
May 2024Part 1 [Part 2]
The Still Manim Editor is a local, real-time coding editor for creating diagrams using the python programming library still-manim. To edit a still-manim diagram, users can edit the code or send simple language commands like "create a weighted graph with 5 vertices." See examples at the link above. See the source code here.
Derived Notes
Goal
Currently, AI cannot independently create a good diagram. No AI tutor can explain concepts using neat visuals, not in ASCII art, pixels, or code.
But AI can reliably accomplish small subtasks by editing code that represents a diagram. With the still-manim editor, my goal was to create a human-AI environment for creating conceptual diagrams via code and natural language.
Intro
Like p5.js, the main interface is a code editor adjacent to the resulting graphic. The core interesting feature is that users can send natural language commands, which an AI fulfills by editing the python code.
Requesting the first step of Dijkstra's in the still-manim editor, with the prompt "show me the first step of dijkstra's":
While the language commands can be useful, they don't always work. If I asked the AI to show the distance labels or show the third step of the algorithm, it might misinterpret me or get stuck. Fortunately, unlike an image or ASCII art, diagram code is something that I as a human can iterate on with a lot of control.
See a better diagram in a larger context hereLanguage Commands and Object Selection
In Practice
A core challenge in designing an editor for creating diagrams is making it intuitive for users to "point at" objects, especially while interacting with an AI. Users might refer to objects verbally, saying things like "the left window on the bedroom above the garage" or "the vertex labeled 6". More intuitively, users could directly select specific semantic objects.
Here is a demo that I created within the web editor, which can also be viewed under "Previous Examples" > "language_commands".
Object Selection Implementation
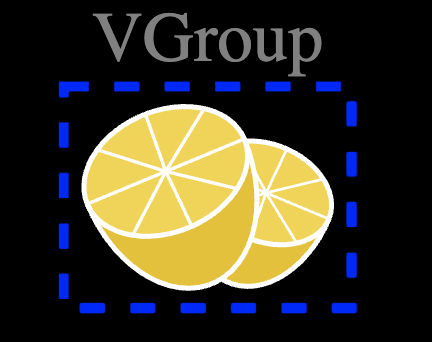
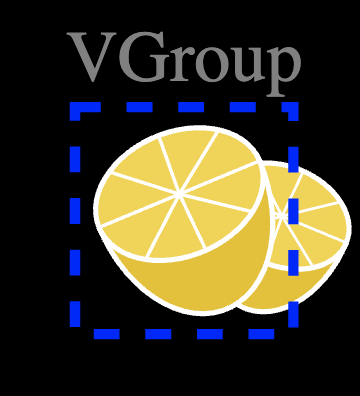
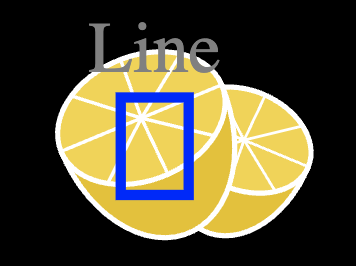
Because still-manim diagrams are defined by code, the semantic objects are segmented by design. The objects in the diagram are part of a tree structure, similar to the HTML DOM of a webpage. Each node in the diagram's tree structure is either a singular object, an object with subobjects, or a group. In the example below, the lemon group object contains the lemon object, which contains the lemon spoke/line object.


Selecting objects within still-manim diagrams requires more than a single click due to overlapping objects. In contrast, the interactive objects of a webpage do not overlap. To address this, I implemented a simple method for selection within the tree structure where:
- Only top-level objects can be selected by default.
- When an object is selected, only it's children, it's siblings, and top-level objects can be selected.
To select multiple objects, hold cmd (mac) or ctrl (windows) while clicking on each object. This selection scheme is good for a working demo but it's limited. For example, two top-level objects with large and overlapping bounding boxes can prevent deeper selection from working in that entire region. Also, it's not possible to select two objects nested within separate top-level branches. Figma's approach handles these cases, but it's harder to implement.
Once selected, an object must have associated metadata that reveals what it is to the AI. In this case, the AI needs to understand the object in the context of the diagram code, so the object metadata is a line number and an access path. The access path is a string that can directly access the variable, if placed after the expression on the specified line number. The LLM prompt might look like this:
"""
...
DIAGRAM CODE:
...

SELECTED MOBJECTS:
0. A vmobject mobject, accessed as `graph.vertices[2]`, defined on line 6
1. A vmobject mobject, accessed as `graph.vertices[3]`, defined on line 6

USER INSTRUCTION:
set these to red
"""
How are these access paths determined?
- Top-level variable assignment:* Top-level variable assignment, while important, has a high price. It shifts unintuitive complexity onto the programmer working on the library and causes a ~4x slowdown when running in the browser.
In the user's code, each variable assignment is captured by
sys.settrace(e.g.g = Graph()) and the line number and variable name are set as instance attributes of the object (Source Code). - Manual assignment: The programmer of still-manim, not the user, must manually set the access path by defining the parent and subpath at object construction.
- Addition to group: The parent of the added object is the group its being added to and its subpath is just the string needed to index into the group (e.g.
[2]). - Addition to canvas: All objects added to the canvas have a backup access path that is
canvas.mobjects[mob_index].
From the above rules, it's possible that an object has multiple access paths.
from smanim import *
s = Square()
g = Group(s, Graph())
canvas.add(s, g)
canvas.draw()
# the squares's access paths includes both "s" and "g[0]"
# the graph's first vertex access paths include "g[1].vertices[0]"
Which access path should be prioritized and provided to the LLM? The following precedence rules are applied:
- Level: Top-level variable declaration > Manual assignment > Addition to group > Addition to canvas
- Ties within a level: Later occurence in the code > Earlier occurence
As a side effect of each object having access path metadata, a neat feature is now possible. When the user selects a object, its corresponding line in the code can be highlighted. I've found this saves me time when navigating the code.
Reflection
While this tool currently doesn't work beyond a demo, this project has some interesting and pointy features:
- Python web editor: It's a python editor in the browser, which uses pyodide.
- Basic visual features: still-manim has programmatic analogs for core features in direct-manipulation graphical editing tools like powerpoint and figma: styling, grouping, layering, labeling, spatial relations, and spatial transformations (see the README for more).
- Complex objects from minimal code: still-manim enables creating complex objects with minimal effort compared to direct manipulation (e.g.
Graph(vertices, edges)).- However, not many complex objects are implemented.
- The combination of basic visual features and complex objects is natural and powerful.
- Interactive connection between diagram and code: still-manim traces variable assignment and object construction in order to associate access paths with each object.
For example, the access path for the first vertex in a graph might be
graph.vertices[0].- A user can select an object in the GUI and have the relevant line of code highlighted.
- A user can select objects before sending a language command to the AI.
- AI-first documentation: Notes.
This project is worth revisiting when AI can use custom programming languages that are not in the training data. For now, it's in Demo Status.
Better Design
If I could redo this tool, I would consider:
- TypeScript over Python: Enabling support for native interactions (e.g. event listeners) and making development easier by avoiding pyodide.
- Structuring the diagram as a tree: Valuing separation of data and graphical content, like React. See Bluefish, which uses a JSX syntax for creating diagrams with similar spatial relations to those offered by manim.
- Designing better language constructs
- (Maybe) Treating spatial relations like
next_toandclose_toas constraints to be maintained during program execution or satisfied at the end. - Deviating more from manim language constructs. The LLM has knowledge of manim. But manim made some quirky language choices that I changed. Because I deviated at all, the LLM was prone to subtle errors.
- (Maybe) Treating spatial relations like
- Reconsider TikZ for creating good language commands: Mostly because TikZ is already in the model weights. TikZ also has a neat WYSIWYG editor. I still think a good diagramming library in a common programming language can have more intuitive syntax and customizability than TikZ.
Framing a problem
Challenge: Design a programming library that generates medium-complex diagrams. These diagrams should include network graphs, cartesian graphs, structural formulas, flowcharts, bar graphs, and any other lightweight graphics we often draw on a whiteboard or create in a jupyter notebook.
We already have separate tools to create these diagrams. Why would we want a single library to combine all these seemingly separate domains?
- Separate tools repeatedly implement the same basic visual features (e.g. styling, grouping, stretching, rotation, etc.)
- Or, often tools are missing one of these essential features.
- It's easier for a programmer to become proficient with the core visual features of one tool, rather than having to relearn them for separate tools.
- Different complex objects could be related to each other in the same diagram (e.g. an Arrow between them)
- All objects could be manipulated using one main user interface. The user could directly manipulate objects or send language commands using AI.